Documentation
NISMOD v2 Transport Model is a national-scale (Great Britain) transport model developed to support policy making regarding future infrastructure. It forecasts the impact of various endogenous and exogenous factors on transport demand and capacity utilisation, following an elasticity-based simulation methodology. The model consists of three submodels covering the following modes of transport: road (passenger and freight vehicle flows), rail (total station usage), and air (domestic and international passenger movements).
1. Key Features
1.1 Road Model
NISMOD v2 Transport Model predicts vehicle demand (inter-zonal flows) for passenger and freight vehicles, and stochastically simulates road traffic on all major UK roads including A-roads and motorways.
It is currently the only national-scale road traffic model capable of routing-based network assignment and provisioning a national-scale origin-destination matrix (on TEMPRo & LAD spatial zoning levels), while achieving a respectable match with AADF traffic counts, total vehicle kilometres, expected number of car trips, and the observed trip length distribution from the National Travel Survey.
The freight model has been modelled after the DfT’s 2006 Base-Year Freight Matrices model, which includes traffic flows for freight vehicles (vans, rigid HGVs, and articulated HGVs) between local authority districts (LADs), sea ports, selected airports, and major distribution centres. The accuracy of the freight model is mostly limited by the spatial zoning system (LAD).
The demand prediction model is elasticity-based and it can predict future vehicle flows from exogenous (scenario-based) changes in population and GVA, and endogenously calculated changes in inter-zonal travel time and travel cost (but also dependent on exogenous interventions such as new road development and congestion charging policies).
Congested travel times on individual road links have been modelled separately for each hour of the day, using the speed-flow curves estimated on English roads (DfT’s 2005 FORGE model), the overcapacity formula from WebTAG, and the passenger car unit (PCU) concept to capture different vehicle sizes.
The number of lanes on each road segment has been estimated by map-matching AADF count point locations to the OpenRoads major road network. This has allowed a distinction between single and dual carriageway A-roads, which are then assumed to have 1 and 2 lanes per direction, respectively.
The network assignment exists in two version and it has been implemented using state-of-the-art routing algorithms. The routing version uses a heuristic search algorithm A* to find the fastest path between two locations using congested link travel times, while the route-choice version uses an advanced discrete-choice model (path-size logit) to choose the optimal path based on distance, travel time, travel cost (fuel and road tolls), and the number of intersections.
The route-choice version of the network assignment uses a route set pre-generated on the IRIDIS cluster of the University of Southampton. This pre-generated route set consists of more than 90 million different route options which enables the national-scale assignment to run within minutes, despite each individual vehicle trip being simulated separately (including time of day choice, engine type choice, route choice).
The model can also incorporate scenarios for changes in vehicle fuel efficiency and changes in market shares of different engine types, including internal combustion engines on petrol, diesel, LPG (liquefied petroleum gas), hydrogen or CNG (compressed natural gas); hybrid EVs (electric vehicles) on petrol or diesel; plug-in hybrid EVs on petrol or diesel; fuel cell EVs on hydrogen, and battery EV. This can be used to test policies such as the fossil fuel phase-out.
Electricity and fuel consumptions are calculated using the four-parameter formula from WebTAG. Behavioural assumptions are made for plug-in hybrid EVs (electricity on urban, fuel on rural road links).
Interventions such as new road development, road expansion with new lanes, and congestion charging zones can be dynamically implemented in each simulated year.
The model can output various metrics on the road link level (e.g. road capacity utilisation, peak hour travel times), zonal level (e.g. vehicle kilometres, EV electricity consumption), inter-zonal level (e.g. predicted vehicle flows, average travel times, average travel costs) and national level (e.g. total CO2 emissions, total energy consumptions). The outputs are in csv and shapefile format, allowing them to be visualised with a software of choice.
The units for energy consumptions are:
- PETROL litres (l)
- DIESEL litres (l)
- DIESEL litres (l)
- LPG kilograms (kg)
- ELECTRICITY kilowatt-hours (kWh)
- HYDROGEN kilograms (kg)
- CNG kilograms (kg)
The units for other outputs are:
- cost skim matrices: pounds GBP (£)
- time skim matrices and link travel times: minutes (min)
- CO2 emissions: kilgrams (kg)
- vehicle-kilometres: vehicle-kilometres (vkm)
- OD matrices: vehicles per day (v/d)
Note that outputs are produced for only one (average) simulated day, so yearly values can be obtained by multiplying those values by 365 - in which case it may become more appropriate to use kilotonnes or megatonnes instead of kilograms, MWh or GWh instead of kWh etc.
1.2 Rail Model
NISMOD v2 Transport Model includes a national-scale rail model for predicting future station usage demand.
It currently uses station usage data for 3054 stations covering National Rail, London Underground, Docklands Light Railway, London Trams (previously Croydon Tramlink), Manchester Metrolink, and Tyne & Wear (Newcastle) Metro.
Elasticity-based demand model predicts station usage (entry + exit) from changes in exogenous inputs including: population, GVA, rail fare index, generalised journey time (GJT) index and car trip costs.
Car trip costs can be provided as an input or calculated from the outputs of the NISMOD road model.
Elasticities of rail fares and GJT vary per elasticity zone (London Travelcard, South-East, PTE, other).
The model implements a policy intervention for building new rail stations in future years.
1.2 Air Model
NISMOD v2 Transport Model also includes an air model that predicts domestic and international passenger movements.
Air demand data is inter-nodal, i.e. between individual airports (domestic - between two UK airports, and international - between a UK airport and an international airport).
Base-year (2015) demand data is obtain from the Civil Aviation Authority (CAA), while information about airports is obtained from CAA, NaPTAN, and ourairports.com.
Demand files use IATA codes (or ICAO where IATA is unavailable) to identify airports and ISO 3166 Alpha-2 codes to identify countries.
Elasticity-based demand model predicts passenger movements from changes in exogenous inputs including: population, GVA, domestic and international fare incides, and trip rates.
2. How to run the model
2.1 Using Eclipse IDE
Install Java Development Kit version 8 from: http://www.oracle.com.
Install Eclipse IDE for Java Developers: https://eclipse.org/downloads/.
Run Eclipse and choose the workspace folder.
Import the existing Maven project from the local git folder where the code has been cloned. In Eclipse: File -> Import -> Maven -> Existing Maven Projects.
Wait until all Maven dependencies (specified in the pom.xml file) are downloaded. If the pom.xml file has been changed, the Maven project should be first updated (Alt+F5).
The classes containing the main method can be run as a Java application. The classes containing the methods annotated with @Test can be run as JUnit tests.
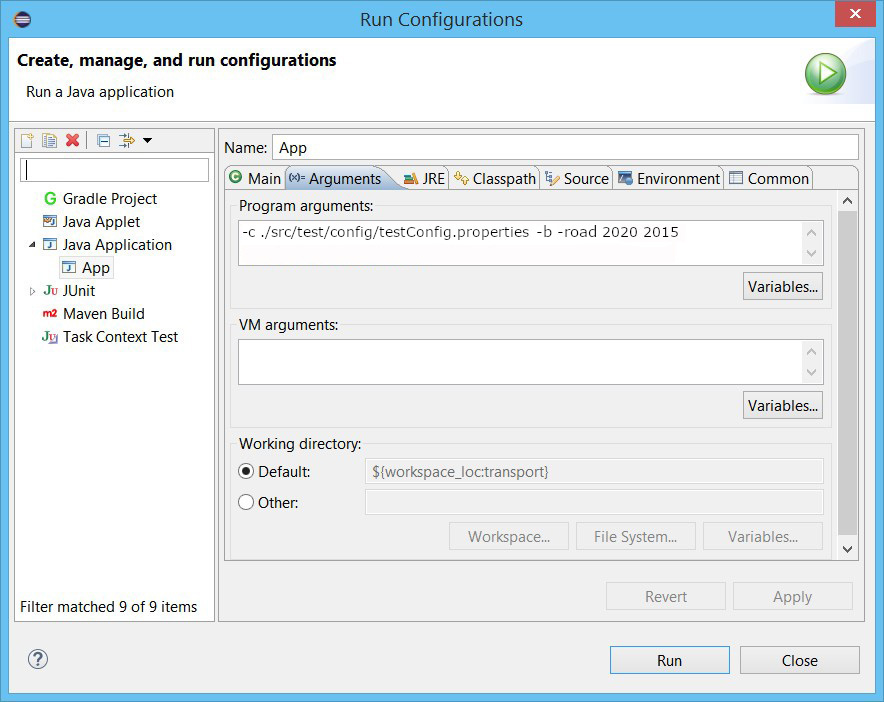
To run the main model in Eclipse, open the Run Configuration for nismod.transport.App.java and pass the path to the config file as an argument:
2.2 Using Command Prompt (Console)
Install Java Development Kit version 8 from: http://www.oracle.com.
Make sure the Java home environment variable is set for the operating system and pointing to the directory where Java Development Kit has been installed.
Download maven, install it and set the environment variables: http://maven.apache.org/.
To build the project type:
mvn clean install
To run the base-year road model (2015) type:
java -cp target/transport-0.0.1-SNAPSHOT.jar nismod.transport.App -c ./path/to/config.properties -b
To predict and run a future year (e.g. 2020) using the results of a previously run year (e.g. 2015), for the road model type:
java -cp target/transport-0.0.1-SNAPSHOT.jar nismod.transport.App -c ./path/to/config.properties -road 2020 2015
To predict and run a future year (e.g. 2020) using the results of a previously run year (e.g. 2015), for the rail model type:
java -cp target/transport-0.0.1-SNAPSHOT.jar nismod.transport.App -c ./path/to/config.properties -rail 2020 2015
To predict and run a future year (e.g. 2020) using the results of a previously run year (e.g. 2015), for the air model type:
java -cp target/transport-0.0.1-SNAPSHOT.jar nismod.transport.App -c ./path/to/config.properties -air 2020 2015
Note
Rail and air model need not be run for the base-year as 2015 demand data is given as an input.
Options:
- To increase the max heap size, run with java -XX:MaxHeapSize=120g …
- To enable debug messages, run with java -Dlog4j2.debug …
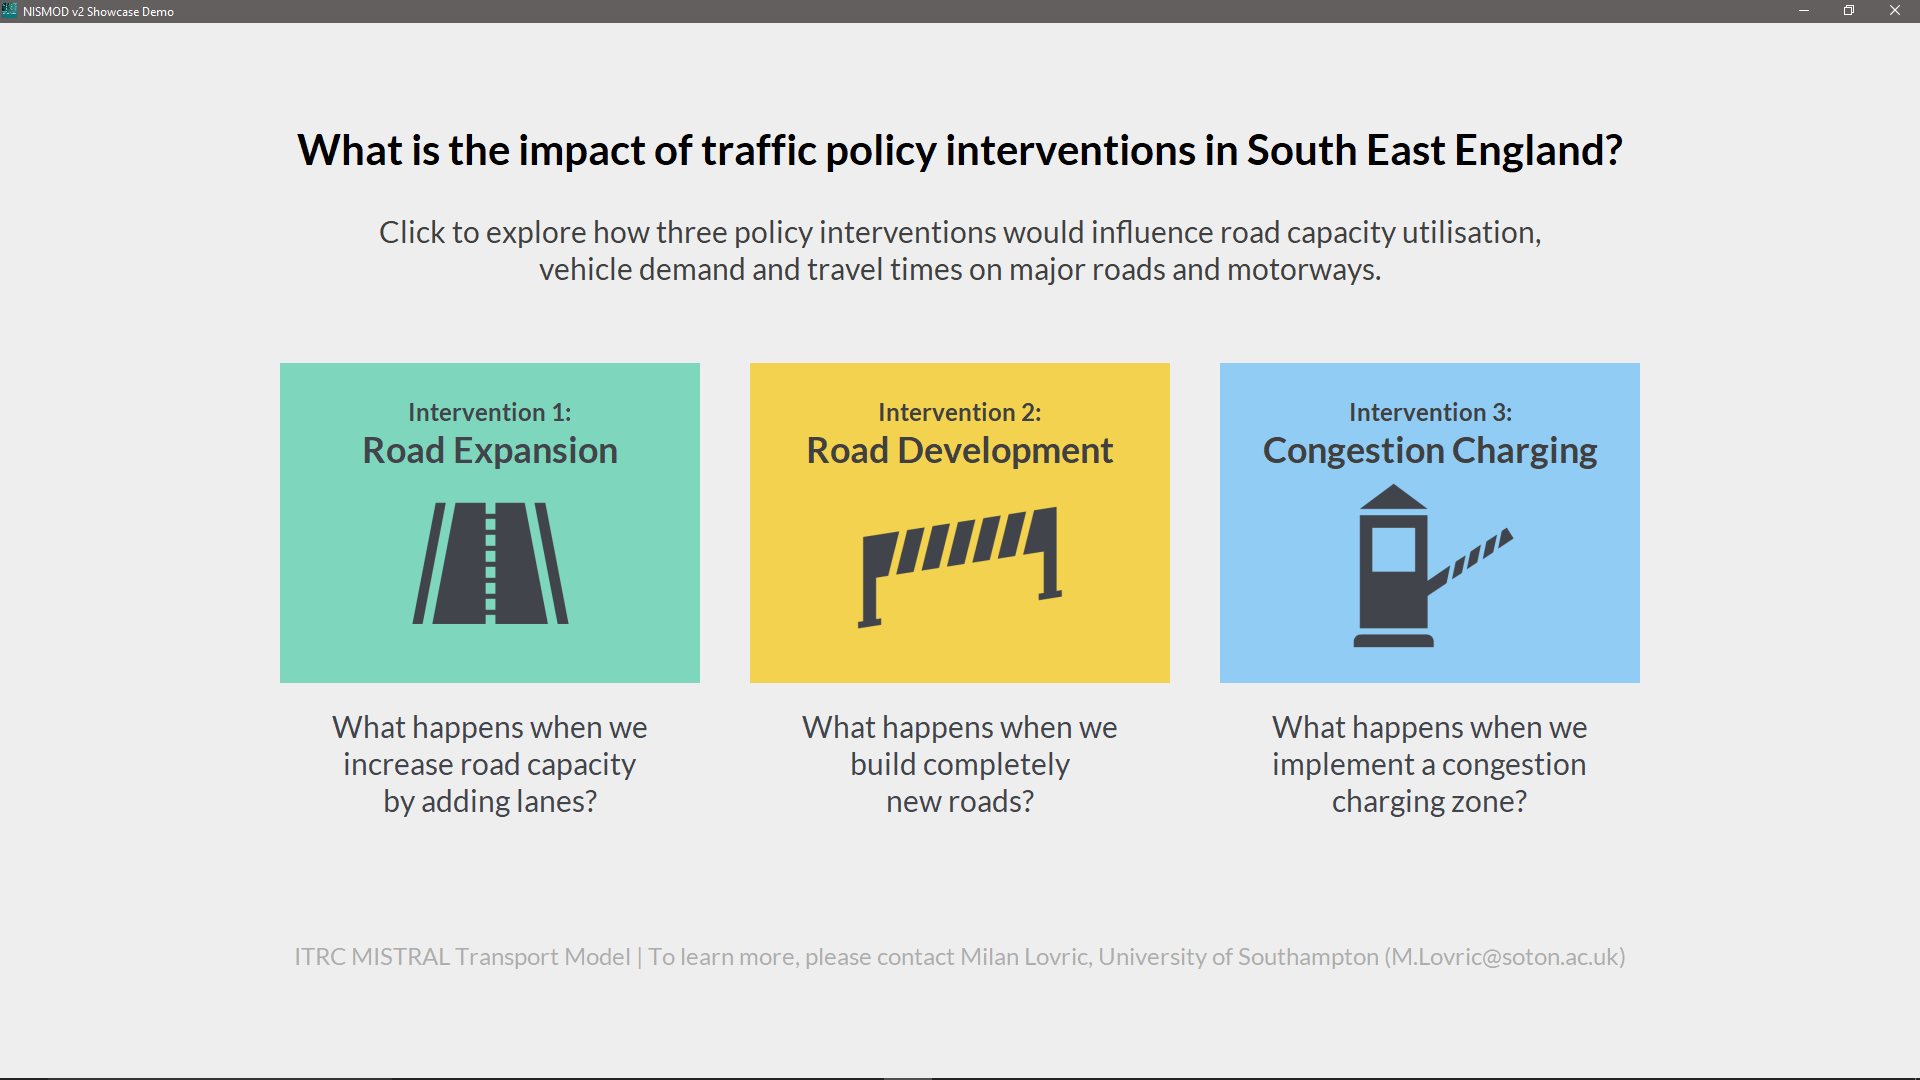
2.3 Showcase Demo
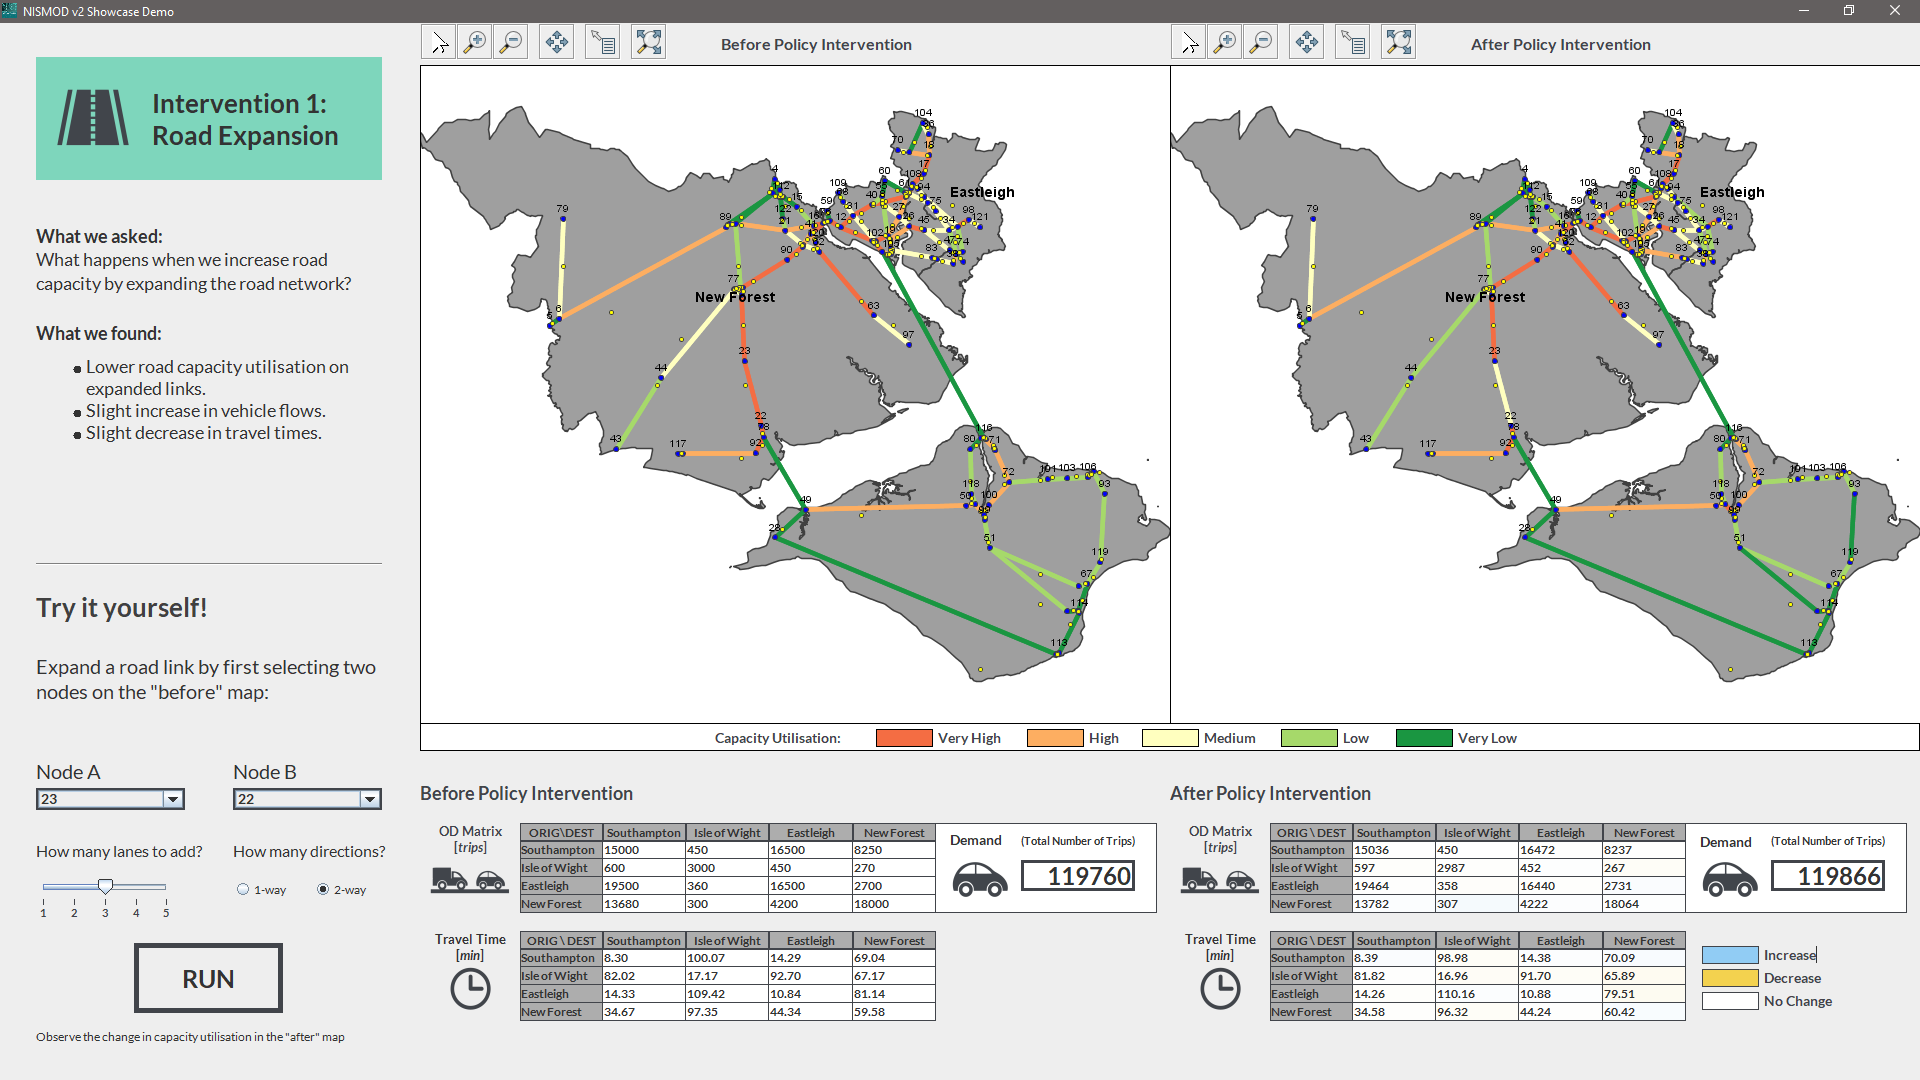
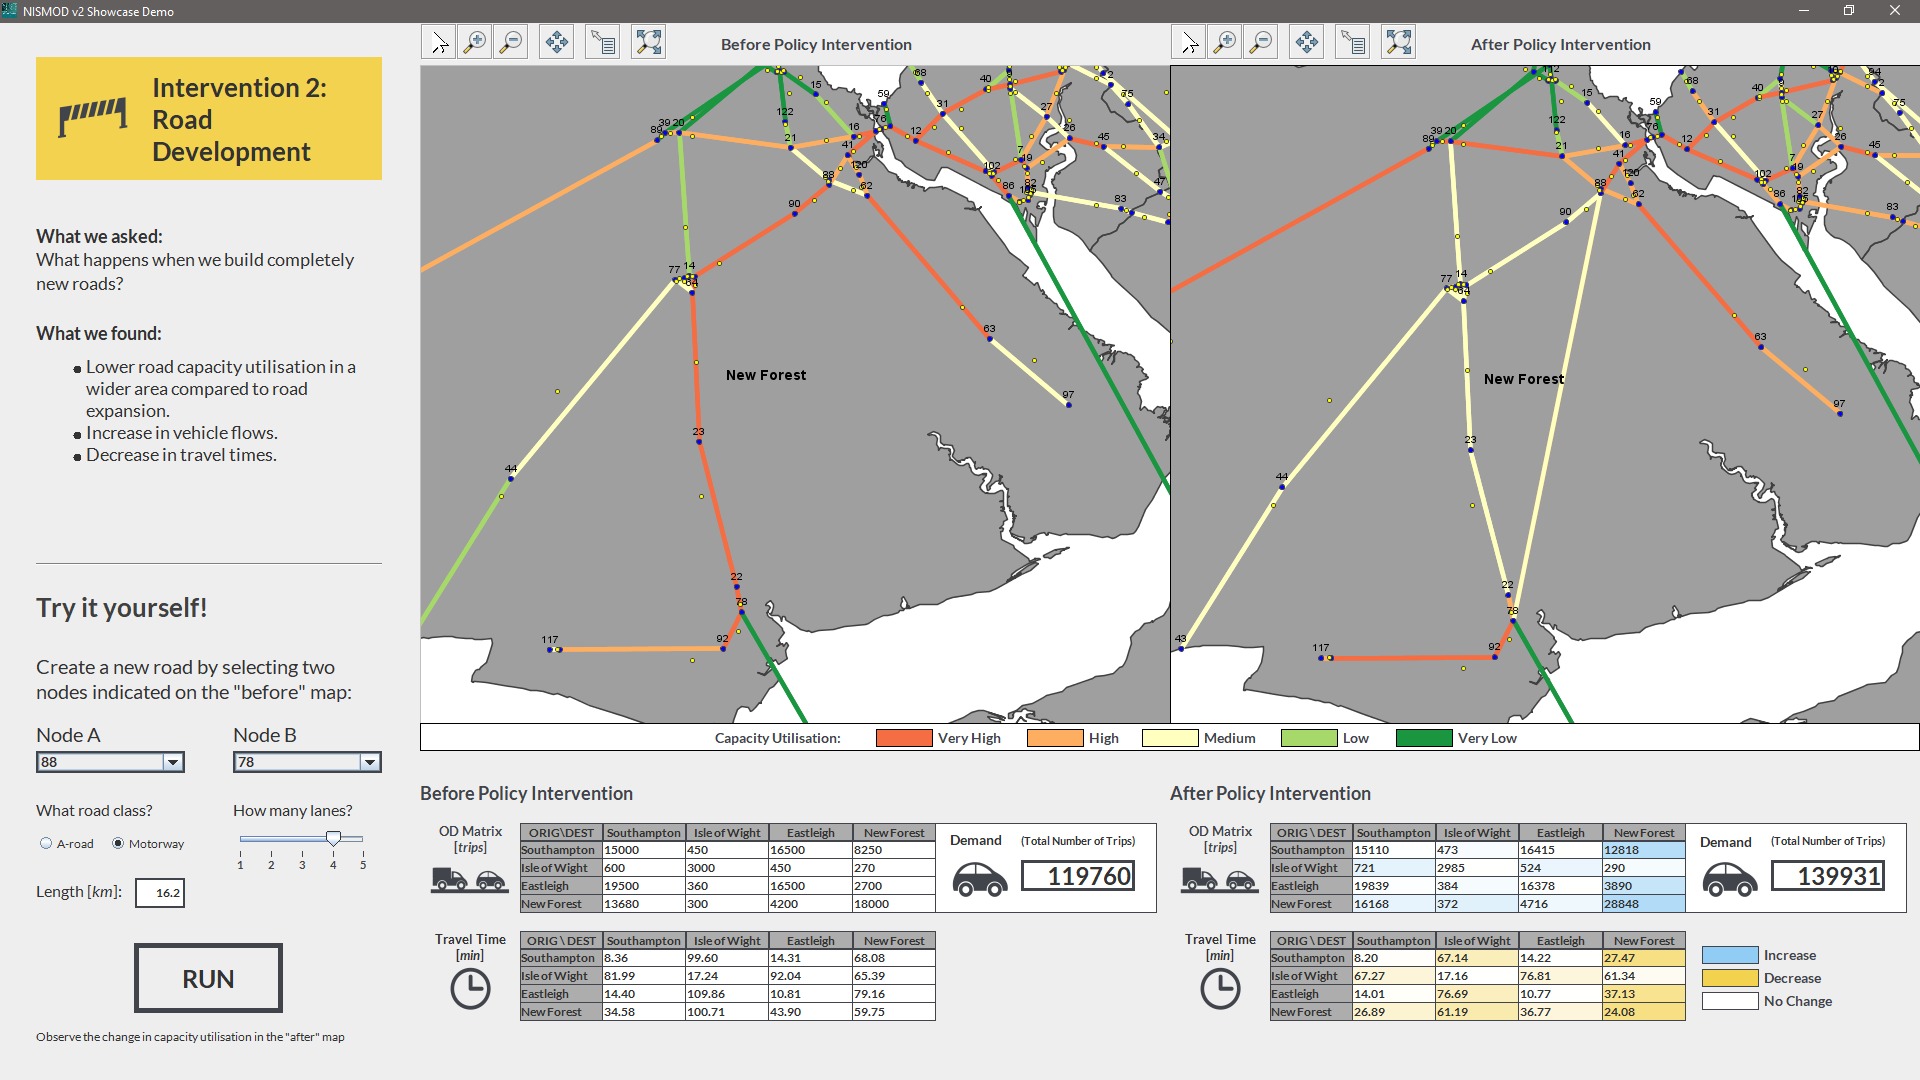
The model provides an interactive showcase demo with three policy interventions in the case study area of South-East England. The interventions are:
Road expansion - expanding existing road links with additional lanes.
Road development - building new road links between two existing intersections.
Congestion charging - time-based (peak and off-peak) congestion charging in the policy area.
To run the showcase demo type:
java -cp target/transport-0.0.1-SNAPSHOT.jar nismod.transport.App -c ./path/to/config.properties -d
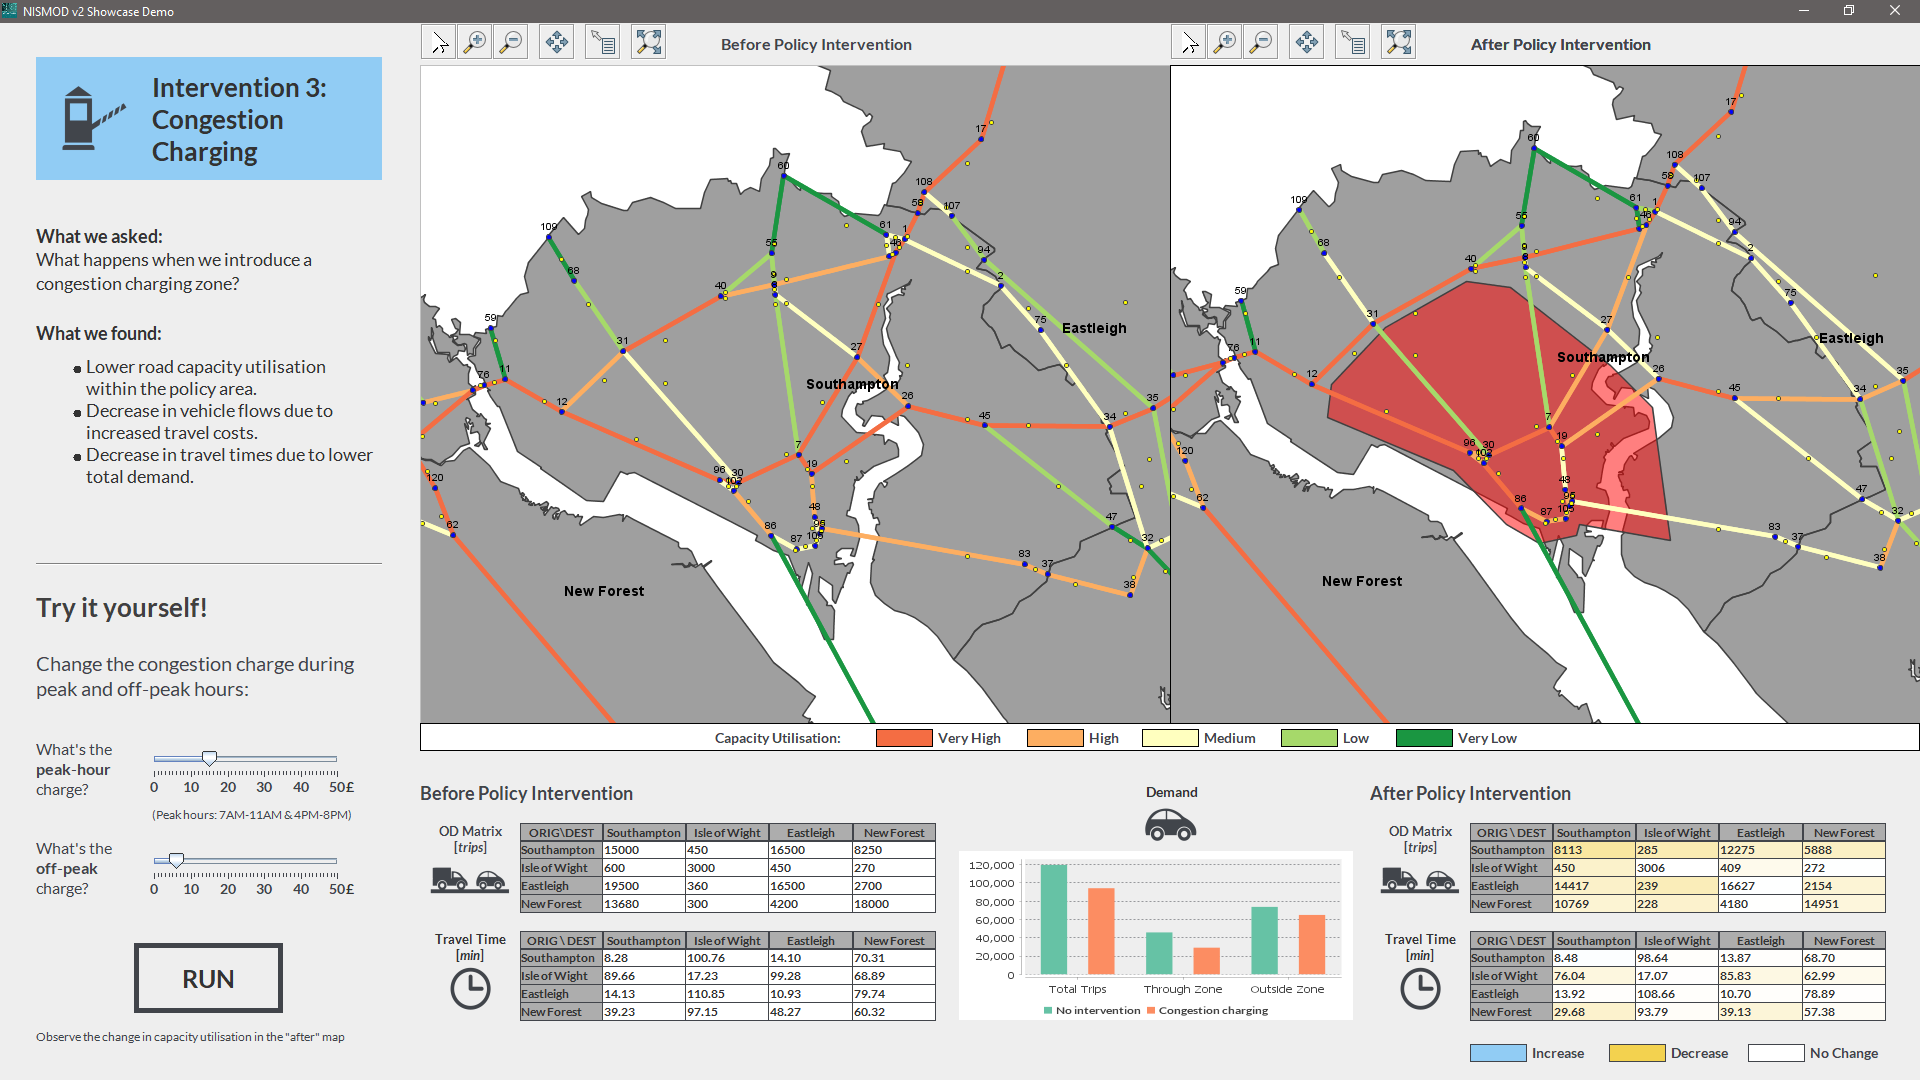
Note
Showcase demo requires a display with a 1920 x 1080 resolution.
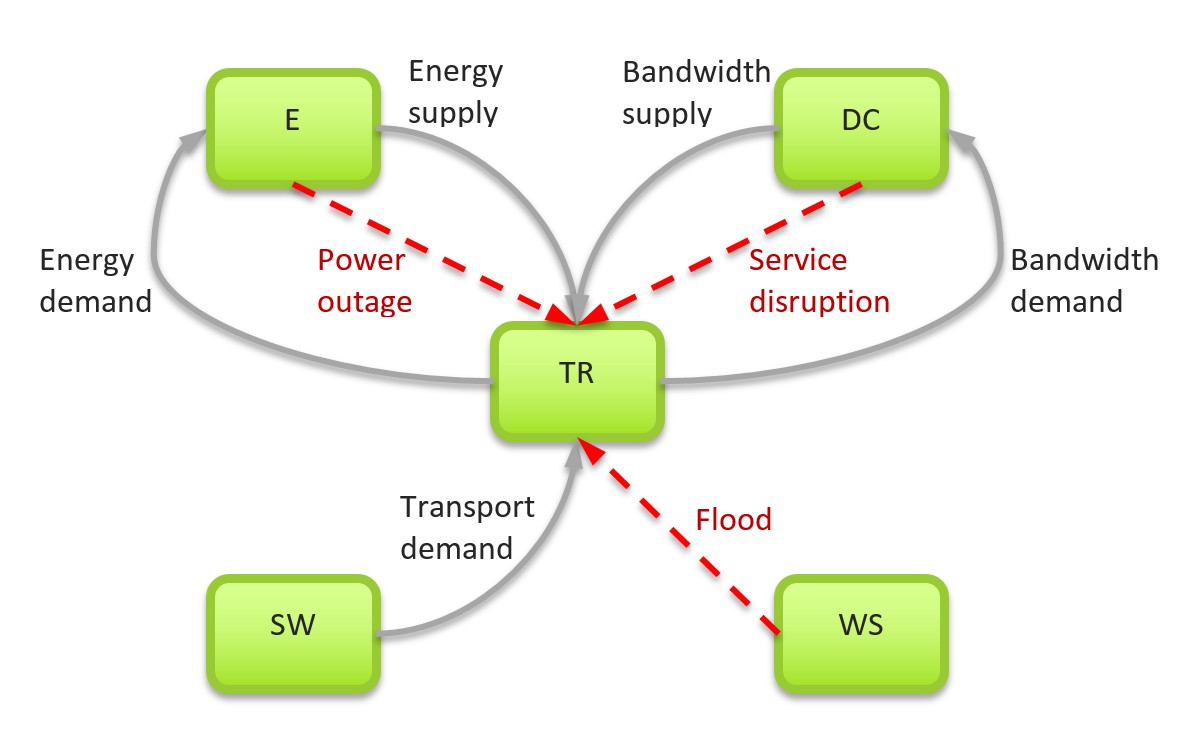
3. Cross-sectoral Dependencies
The UK transport sector has various links with other infrastructure sectors:
Energy: energy consumption, fuel price, electrification of vehicles, fuel transport, power outage (rail and air disruption).
Digital Communications: supporting smart mobility (e.g. mobility as a service, autonomous mobility on demand), coverage and service disruptions.
Water: floods causing road and rail disruptions.
Solid Waste: waste transport (e.g. waste exports through seaports).
To enable studies of some of those cross-sectoral interdependencies, the transport model has been integrated into a wider Simulation Modelling Integration Framework (smif): https://github.com/nismod/smif
4. Acknowledgments
This work has been undertaken at the University of Southampton, as part of the ITRC consortium, under grant EP/N017064/1 (MISTRAL: Multi-scale InfraSTRucture systems AnaLytics) of the UK Engineering and Physical Science Research Council (EPSRC). https://www.itrc.org.uk/
The test resources contain a sample of data and shapefiles that come with the following licencing and copyright statemens:
- Open Government Licence http://www.nationalarchives.gov.uk/doc/open-government-licence/version/3/
- Contains National Statistics data © Crown copyright and database right 2012.
- Contains Ordnance Survey data © Crown copyright and database right 2012.
The authors acknowledge the use of the IRIDIS High Performance Computing Facility, and associated support services at the University of Southampton, in the completion of this work.
The implementation uses an open source library GeoTools for geospatial processing. http://www.geotools.org/about.html